

The ARPL View
- Rare earth markets are small, segmented, and not structurally undersupplied, but their importance to high-value industrial and defense supply chains means disruptions have consequences far out of proportion to the value of the underlying minerals.
- China’s industrial, technical, and geological advantages imply that export restrictions are highly effective in the short term. Its leverage will erode once importing countries establish enough qualified and reliable alternative supply to prevent restrictions from choking priority industries.
- Complete decoupling is unnecessary and expensive. A well-designed de-risking strategy can achieve the core supply-security objective with a limited number of projects focused on separation, metals and alloys, magnets, and other specific bottlenecks.
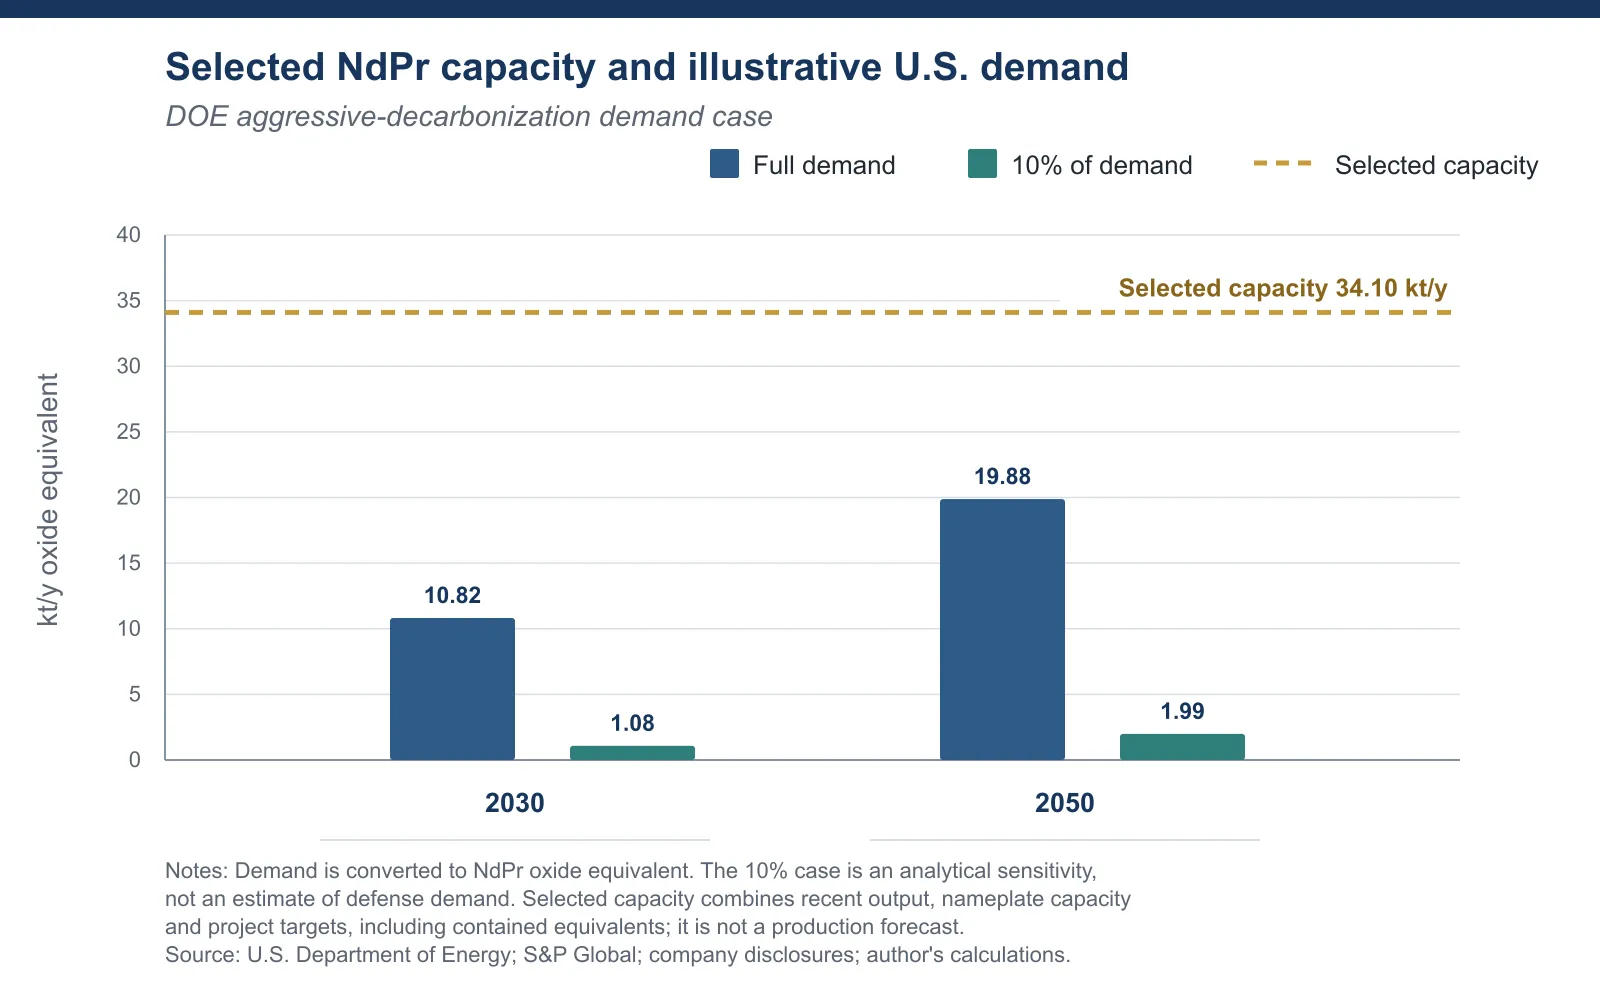
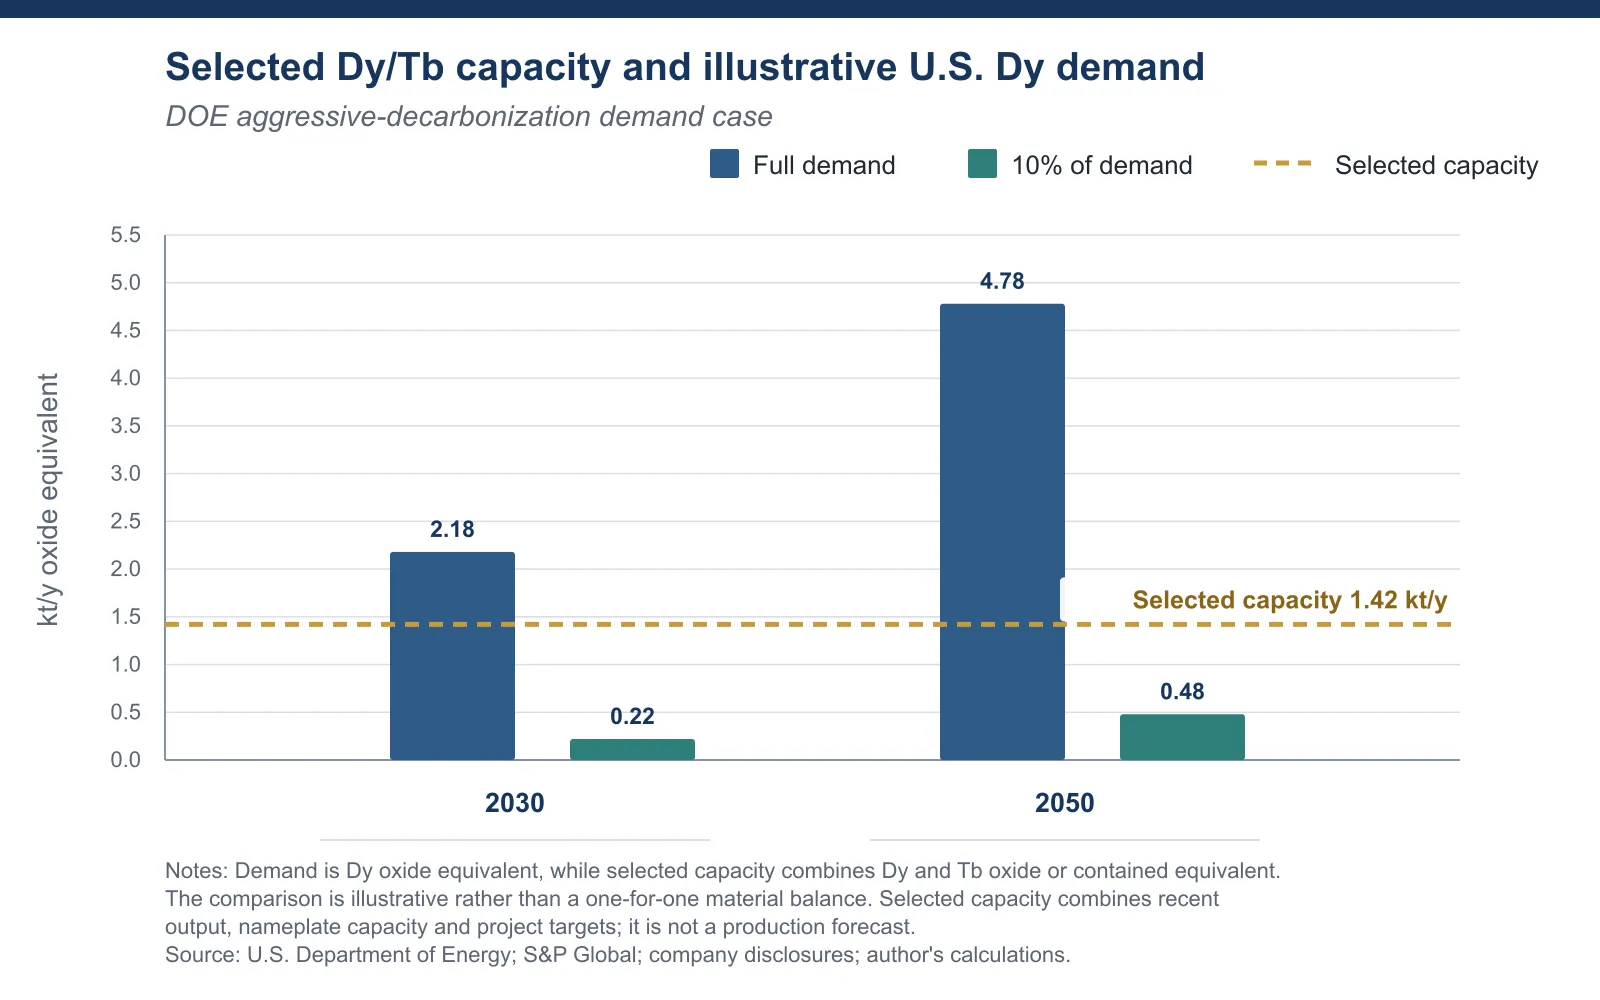
- Our illustrative analysis suggests that the current pipeline is already large relative to that objective from the U.S. perspective. Selected NdPr capacity equals roughly 3.2 times the total U.S. demand in 2030 as estimated by the Department of Energy, and 32 times an illustrative de-risking case of 10% of demand; selected Dy/Tb capacity equals approximately 65% of projected 2030 Dy demand but 6.5 times the corresponding de-risking case.
- Heavy rare earths remain the most acute vulnerability and command extreme price premiums, but their long-term demand is also uncertain. High prices are accelerating efforts to reduce Dy and Tb intensity, substitute other materials, expand recycling, and develop magnet and motor designs that use fewer or no heavy rare earths.
- The advanced stage ex-China pipeline is at risk of outrunning durable policy-supported demand in particular markets and stages of the supply chain. As alternative supply weakens Chinese leverage, displaced Chinese material will place pressure on global benchmarks, while the political and fiscal cost of sustaining higher-cost capacity will become more visible.
- Consumer countries should carefully define how much de-risking is sufficient, coordinate investments with allies, prioritize unresolved choke points, and prepare to support essential capacity through weak markets.
- Producer countries should prioritize committed demand and offtake, focus on projects with durable advantages, sequence investments across the supply chain, and prepare for long-term uncertainty in price premiums and foreign support.
- Countries hoping to be both major consumers and producers of new supply have an advantage the others lack: they can secure some demand certainty internally. Nonetheless, they too must calibrate their production against durable demand to avoid overbuilding.
Introduction
The strategic importance of rare earth elements to supply chains critical to energy, defense, and consumer technologies, and China’s willingness to leverage its dominance as a supplier for geoeconomic bargaining, have thrown them into the spotlight. These strategic minerals are now top-of-mind for policymakers globally, whether their concerns are centered on national security, the energy transition and economic resilience, or the industrial opportunities that mining and magnet production may offer. Across the last ten years of national policy initiatives toward strategic minerals tracked and compiled by BloombergNEF, the largest share targeted rare earths.1
Rare earth markets are distinct from other minerals markets in a few ways that enable unique leverage. Via their importance for high-strength permanent magnets, rare earth elements are essential and ubiquitous inputs to technologies ranging from electric motors and industrial machinery to defense systems, energy technologies, and consumer electronics. China dominates rare earth supply chains, particularly the mid and downstream: China controls about 60% of mined supply, 91% of refining, and 94% of sintered permanent magnet production. Meanwhile, markets for rare earth minerals are thin and structurally fragile, with limited price transparency. Taken together, supply is relatively inelastic, while demand in key applications is difficult to substitute in the short term, making rare earths particularly vulnerable to geopolitics, trade restrictions, or export controls.
As a result, rare earths are no longer viewed as least-cost commodity markets in which polluting or capital-intensive stages can simply be outsourced, but as strategic industrial inputs whose supply must be secured, and governments and selected industrial consumers in the U.S., Japan, the EU, India, Saudi Arabia, and elsewhere are increasingly willing to pay a security premium through public support mechanisms. Countries with current or prospective production outside of China are seeking to capitalize on this momentum, dishing out support and incentives to burgeoning industries, hoping to expand domestic industries in separation, refining, magnets, and other downstream activities. Countries with deposits, especially of heavy rare earths, are no longer competing only to mine and export them, but to secure a larger share of the value created by supply-chain disruption, strategic rivalry, and the growing premium placed on security of supply.
However, despite their criticality and contentious geopolitics, rare earth resources are not globally scarce, and announced capacity is broadly sufficient in aggregate. Markets are small relative to bulk mined commodities, highly segmented across elements, and dominated in value by the four magnet rare earths most critical to motors and generators. The central risk and opportunity is not an absolute lack of global resource availability, but the concentration of processing, separation, and magnet manufacturing in China-centered supply chains. Even under strong demand growth, recent analysis from the International Energy Agency (IEA) suggests that global supply is broadly sufficient to meet projected needs; gaps are driven by geopolitical, commercial, and technical concerns. The upshot is that the current and future opportunity for ex-China supply is driven less by absolute physical scarcity than by the willingness of consumer countries to pay for resilience, redundancy, and reduced strategic dependence.
This has important implications for both consumers seeking to provide strategic support to rare earth projects, as well as producer countries seeking to capitalize on the momentum. There is real need and opportunity to expand supply, but the size and durability of the opportunity will depend on how much alternative supply consumer countries decide is sufficient, which projects they are prepared to support when prices fall, and how China responds as its market power begins to erode. When ex-China supply comes online, it could have the paradoxical effect of encouraging China to release cheaper Chinese material back into global markets, amplifying price pressure across oxides, metals, and magnets.
China’s leverage over rare earth supply chains will erode quickly and nonlinearly once enough qualified alternative supply is available, which will reduce both the need and the appetite for complete “decoupling.” It will become increasingly clear that the objectives of a decoupling strategy can be met more cost effectively with a well-designed de-risking strategy. As a result, durable industrial opportunities for prospective producer countries will also likely be somewhat limited.
To manage these risks carefully, consumer countries should weigh which deposits and investments are most attractive, and strategically target the amount of supply sufficient to diversify, while prioritizing bottlenecks in the mid and downstream. Producer countries, meanwhile, should approach rare earths with a clear-eyed strategy grounded in mutually beneficial and committed offtakes, and realistic competitive advantages. A rare-earths-focused industrial strategy needs to remain durable when premiums narrow, state support falters, technologies evolve, recycling expands, and Chinese supply is redirected toward other customers, exported through products further downstream, or operated at lower utilization. Countries seeking to lead both consumption and production of new supply will need to navigate all the above considerations simultaneously.
Small market, big consequences
“Rare earths” amalgamates 17 chemically similar elements with distinct uses, prices, supply risks, and market balances. Their markets are also unusually opaque, due to both their size and concentration of production. Prices are thinly reported, contracts are often settled bilaterally, and each mine produces a different composition of elements; several are often co-recovered and usually need to be separated into oxides. Combined, their market is tiny: global mine production of all rare earth oxides was about 390,000 metric tons in 2024 — about 10% of global primary nickel production and less than 2% of primary copper production.
The four rare earths essential for permanent magnet manufacturing (neodymium, praseodymium, dysprosium, and terbium) account for over 80% of the global rare earth market by value, while more abundant elements like lanthanum and cerium can be difficult to monetize in the same proportions in which they are produced.2 Both policy and market analysis tend to focus on these four “magnet rare earths.”
The mismatch between the scale of magnet rare earths and their importance to industry and geopolitics is striking, given their current irreplaceability in essential applications. The IEA estimates that full implementation of China’s expanded rare-earth export controls could expose USD 6.5 trillion in annual downstream production outside China — more than 600 times the value of the global rare-earth market itself. Similarly, rare earth materials make up less than 1% of a vehicle’s value, and the IEA estimates that even a tripling of rare earth prices would add only about 0.1% to the cost of a car.
Consumer countries are therefore very willing to pay a “security premium” to guarantee rare earths supply, and additional supply can appear inexpensive to finance compared to the potential security benefits it provides. However, consumer countries could achieve these ambitions with only a handful of well-selected and supported projects, and each new investment faces considerable risk in a market this small and opaque. Given the lack of complete coordination across ex-China supply buildouts, there is a high risk of supporting more capacity than the market can operate competitively.
Demand is growing, but chemistry is mutable
Rare earth demand is projected to expand significantly through 2050, following growth projections in the technologies that depend on them for permanent magnets — especially electric vehicles, wind turbines, and other technologies central to electrification. Demand growth scenarios, however, are highly sensitive to the assumptions that underpin them; in this case the pace of electrification, the rate of technology deployment, changes in technology design and material intensity, advances in recycling, and potential substitution away from rare earths altogether.
There are key distinctions among the four magnet rare earths. Neodymium and praseodymium (NdPr) occur together in most deposits and are commonly produced, marketed, and used as a combined product. NdPr are key to the common neodymium-iron-boron (NdFeB) magnets, which are about 30% rare earths by weight. Dysprosium (Dy) and terbium (Tb), meanwhile, are added in much smaller quantities to rare earth magnets to increase coercivity — in other words, to help magnets resist demagnetization and retain their performance at elevated operating temperatures. They are somewhat substitutable, and typically only one is used. Due to differences in their atomic structure, NdPr are usually referred to as “light rare earths” and Dy/Tb as “heavy rare earths.” Dy and Tb are scarcer and supported by fewer deposits and much less processing capacity outside China, making them substantially more expensive by weight. As of July 31, 2026, Platts assessed Dy and Tb oxide in North America at $2,300/kg and $4,900/kg, respectively, compared with $115/kg for NdPr oxide. The North American NdPr assessment was only about 3% above its Chinese equivalent, whereas Dy was almost 11 times and Tb nearly 5 times their respective Chinese prices.3
Due to their higher cost, manufacturers are making strides to reduce the amount of heavy rare earths needed in some applications, explore more readily available replacements, and even develop designs to engineer out rare-earth permanent magnets from key applications altogether. Industry and market analysts alike recognize increasing uncertainty in the long-term demand outlook for heavy rare earths. It is very likely that scenario exercises extending today’s chemistry unchanged through 2050 overstate the durable market for Dy and Tb, and perhaps even NdPr as well. While the market will undoubtedly grow, especially in the short term, the long-term rate of growth remains highly uncertain.
The limits of Chinese leverage
China has built an unusually efficient and geographically integrated rare earth magnet economy centered around two key feedstocks. Within China, most light rare earth supply comes from large deposits in Inner Mongolia and northern China, with separation, refining, and magnet manufacturing capacity concentrated nearby. Heavy rare earth supply, meanwhile, has historically come from low-cost ionic-clay deposits in southern China and, increasingly, from similar heavy-rich feedstock imported from Myanmar and brought into China for separation and downstream conversion. These deposits are uniquely high quality, and few alternatives exist globally. Separating and refining rare earths is difficult and expensive, and China has achieved technological and cost gains through decades of accumulated experience. It is also extremely hazardous and environmentally intensive — and in Myanmar, conflict-linked. Ex-China supply competes against a system in which pollution and governance costs are often externalized.4
China also has by far the world’s largest industrial market for rare earths, creating a strong demand base that has incentivized aggressive domestic supply build-out. China’s share of global rare earth consumption increased from 25% in 2000 to more than 70% during 2018–2022; over the latter part of that period, U.S. consumption was only around 4% of China’s. Much of the rare earth material mined outside China still passes through Chinese facilities, either for processing or for final end-use. Building alternative supply chains therefore also depends on coordinating sufficient downstream demand through domestic manufacturing, long-term offtake, procurement, or other policy support. S&P estimates that China now accounts for approximately 86% of first-use NdPr consumption due to its dominance in magnet manufacturing and represents about 62% of global end-use demand for magnets. The domestic industry can therefore consume most, but not all, domestic production capacity, and exports remain essential.
These advantages underpin China’s current leverage over supply chains. In the short term, demand in key applications is difficult to substitute, while new mines, separation facilities, and magnet plants can take years to bring online. Even where sufficient material exists globally, export restrictions have created immediate shortages in targeted products, raising prices and interrupting production. In the longer term, however, China’s leverage will erode quickly as alternative supply develops. As modeled by Resources for the Future in a game-theoretic analysis, restrictions benefit China while importing countries remain dependent, raising prices and creating bargaining leverage, but sustained restrictions make investment in alternative capacity increasingly rational. Once qualified supply comes online, China loses market share, its downstream facilities face lower utilization, and its ability to create an immediate choke point declines. The model suggests that temporary restrictions are more useful to China than a prolonged withdrawal from world markets, because it can create pressure and then restore supply before competing projects become commercially viable. That strategy has limits, however, because repeated restrictions change expectations and can persuade importing countries to support alternatives despite their higher cost. In other words, the rest of the world needs only enough qualified and reliable supply that the loss of Chinese material can no longer credibly threaten its own supply chains.
Crucially, the emergence of ex-China capacity will have a knock-on effect, freeing up Chinese supply across the chain, from oxides to separated metals, alloys, and magnets, because there is no structural gap between global aggregate supply and demand. As buyers redirect ex-China demand toward policy-driven supply expansion, the Chinese material they previously consumed remains in the market. China must absorb it domestically, or more likely, redirect it toward other export markets, or ultimately operate its facilities at lower utilization. In parallel, generous subsidies and investment across Chinese manufacturing and green technologies (which dominate downstream demand) are already contributing to “involution”: excess capacity, intense price competition, compressed margins, and growing pressure to export manufactured products from finished steel products to EVs. Slowed demand growth would leave China with even less capacity to absorb material displaced by new ex-China supply.
Partial commercial “bifurcation” is emerging in and around global supply chains. China-origin material continues to trade against Chinese benchmarks, while selected non-China projects increasingly rely on a suite of public support mechanisms that can support realized prices above Chinese spot assessments. However, complete bifurcation is unlikely, because the physical supply chain remains deeply integrated. China imports feedstock from Myanmar, Malaysia, and elsewhere, while ex-China producers have often relied on Chinese processors and buyers. Until April 2025, most concentrate from Mountain Pass was sold through Shenghe to refiners in China; Serra Verde in Brazil (which USA Rare Earth acquired in September 2026) likewise entered production with long-term Chinese offtake agreements because comparable separation capacity was unavailable elsewhere. Even when specific projects avoid China, supply chains invariably cross several jurisdictions where the lines are blurred. Lynas mines ore at Mount Weld in Australia and processes it in Malaysia. While Brazil is attracting U.S.-backed investment into Serra Verde, it is continuing to pursue mineral trade and access to processing technology from China.5
Long-term effects could ripple across supply chains, as freed-up Chinese oxide supply would likely place downward pressure on global prices and thereby weaken the economics of higher-cost mines and separation facilities, even if public support mechanisms shield ex-China suppliers from these dynamics in the short term. Lower Chinese metal and alloy prices could widen the cost difference between China’s integrated system and newer ex-China facilities operating below scale, while additional magnet exports would likely pressure plants facing higher operating costs. Falling prices could make premium-priced offtake agreements harder to justify, delay financing for subsequent projects, reduce capacity utilization, and ultimately weaken public support, especially if full export restrictions do not persist.
Even the most aggressive consumer countries are unlikely to require complete decoupling from China to limit its ability to choke supply and use rare earths as a bargaining tool. Full independence would likely be unnecessarily wasteful; sufficient de-risking instead requires qualified and politically reliable capacity at the most important choke points, supported where necessary by inventories, redundant suppliers, and targeted processing or magnet production. The strategic returns will diminish as this capacity comes online; each additional project provides a smaller reduction in vulnerability. Policymakers may continue to frame their ambitions in terms of independence, but willingness to pay large premiums will likely weaken once basic security objectives have been achieved and industrial consumers again press for lower-cost material. The long-term opportunity depends on how much diversification consumer countries ultimately consider sufficient, while the projects providing that security will likely require continued support as their success reduces scarcity, incentivizes China to release supply back into global markets, and weakens prices.
Illustrating the scale of opportunity
Since the raw global demand outlook is a poor metric for the scale of the policy-driven opportunity, we present an illustrative analysis comparing capacity of ex-China projects in advanced development stages with two U.S. demand cases: complete displacement of Chinese supply under an aggressive demand scenario, as an aggressive U.S. benchmark, and a more limited de-risking case. The exercise is intended to ground and frame the risk of overbuilding alternative supply; it does not identify a precise threshold for limiting Chinese leverage.
We utilize estimates from a 2022 U.S. Department of Energy assessment that modeled economy-wide demand for NdFeB magnets under a “high-growth” scenario based on aggressive decarbonization.6 Growth in the model is driven principally by electric vehicles and offshore wind demand, while the model assumes successful deployment of then-current policies and holds 2020 magnet chemistries constant. The policy assumption in particular is strongly conservative here, given recent policy impacts on demand. We convert DOE’s embedded NdPr and Dy metal estimates into oxide equivalents for comparison with project capacity.7 Recall that only Dy or Tb is needed, to improve magnet performance; DOE considers only Dy demand. The scenarios provide an aggressive case because it combines DOE’s most aggressive scenario with complete coverage of projected U.S. requirements from ex-China supply, while excluding the substitution, recycling, and price responses that could reduce primary demand. For an illustrative “de-risking” scenario, we reference the upper end of expert estimates that defense-related magnets account for roughly 2–10% of the U.S. market and use it as a deliberately generous proxy for priority demand; because DOE’s projected growth is driven mainly by civilian EV and wind deployment, and not defense technologies, that share would fall over time. The sensitivity is intended to put scale around a more limited de-risking objective and does not establish either an exact defense requirement or a threshold for neutralizing Chinese leverage.
| Year | U.S. NdPr metal | NdPr oxide equivalent | 10% NdPr oxide | Embedded Dy metal | Dy oxide equivalent | 10% Dy oxide |
|---|---|---|---|---|---|---|
| 2020 | 4.30 | 5.06 | 0.51 | 0.60 | 0.69 | 0.07 |
| 2030 | 9.20 | 10.82 | 1.08 | 1.90 | 2.18 | 0.22 |
| 2050 | 16.90 | 19.88 | 1.99 | 4.16 | 4.78 | 0.48 |
Units are expressed in kilotons. Method: oxide equivalent = embedded metal ÷ metal-to-oxide factor. Source factors: 0.850 for NdPr and 0.871 for Dy. The scenario holds then-current chemistry and does not model substitution or price response.
To compare these demand cases with potential supply around 2030, we select operating and advanced-stage ex-China capacity (Table 2), combining recent production with nameplate capacity, near-term project targets, and identified expansions at existing facilities, while excluding the much larger universe of early-stage and feasibility-stage projects. The reference includes White Mesa’s current NdPr capacity and planned expansion; initial heavy-rare-earth expansion is under construction, while the larger Phase II remains subject to further execution, feedstock, commissioning, and qualification risk. NdPr and Dy/Tb values for Serra Verde and Longonjo, and NdPr for Yangibana, are reported as contained equivalents in mixed carbonate or concentrate and will still require downstream separation. Browns Range and Donald are not added separately because they are intended to provide feedstock to Iluka’s Eneabba refinery and White Mesa, respectively; counting both the upstream material and the downstream facilities as independent supply would double-count different stages of the same production chain. Caremag is also excluded from the selected total because it represents conversion capacity dependent on third-party or recycled feed rather than additional primary supply. The appendix provides detailed information on each project’s stage, product form, capacity basis, conversion requirements, and sources.
| Project / location | Chain stage / product | Capacity basis | NdProxide or contained equiv., kt/y | Dy/Tboxide or contained equiv., kt/y |
|---|---|---|---|---|
| Mountain Pass / MP Materials United States | Mine, concentrator & separator / separated NdPr oxide | Q1 2026 output annualized | 3.668 | – |
| Lynas / Mt Weld + Malaysia Australia / Malaysia | Mine, concentrator & separator / separated oxides | FY2026 reported output | 7.260 | 0.062 |
| Nolans / Arafura Australia | Planned integrated mine-to-oxide / separated NdPr | Nameplate; FID reached May 2026 | 4.440 | – |
| Eneabba / Iluka Australia | Refinery / separated NdPr, Dy & Tb oxides | Nameplate; under construction | 5.500 | 0.725 |
| Pela Ema / Serra Verde Brazil | Mine & concentrator / mixed rare earth carbonate | End-2027 target; contained equivalent | 1.140 | 0.193 |
| White Mesa / Energy Fuels United States | Mill & planned separator expansion / separated oxides | 1.0 kt current NdPr + planned expansion; HREE expansion under construction | 6.294 | 0.368 |
| Yangibana / Hastings Australia | Mine & concentrator / concentrate | Target; contained equivalent; first production Q4 2026 | 3.400 | – |
| Longonjo / Pensana Angola | Mine & concentrator / mixed rare earth carbonate | Under construction; commissioning 2027; contained equivalent | 2.400 | 0.073 |
| Selected capacity total | 34.102 | 1.421 | ||
Notes: NdPr and Dy/Tb values for Pela Ema and Longonjo, and NdPr for Yangibana, are contained equivalents rather than separated oxides. The demand comparison measures Dy, while supply combines Dy and Tb; it is therefore illustrative rather than a one-for-one material balance. Lynas’ 12.0 kt/y NdPr expansion is excluded from the selected total, which uses FY2026 reported output. See Appendix Table 2A for project-level caveats, broader S&P cross-checks and sources.
On the stated-capacity basis, selected NdPr capacity totals 34.1 kt/y, roughly 3.2 times the DOE estimate of U.S. demand in 2030 and 1.7 times estimated demand in 2050. Against the narrower de-risking case, the same projects equal approximately 32 times 2030 demand and 17 times the 2050 demand. Some projects will inevitably ramp more slowly than planned, operate below nameplate capacity, or produce intermediate material requiring further conversion and qualification. Even allowing for these constraints, however, the pipeline is already significantly larger than what would be needed simply to establish sufficient alternative supply to limit Chinese leverage in the U.S. market.
Meanwhile, selected Dy/Tb capacity totals 1.42 kt/y, approximately 0.65 times estimated U.S. Dy demand in 2030 and 0.30 times demand in 2050, while equaling approximately 6.5 times and 3.0 times the respective 10% de-risking requirement. This highlights why the remaining vulnerability is concentrated largely in heavy rare earths, explaining both the extreme price premium (North American Dy is almost 11 times and Tb nearly 5 times their respective Chinese prices while NdPr is almost equal to its Chinese equivalent) and the urgency surrounding new heavy-rich deposits and separation capacity. As manufacturers are making strides to innovate away from heavies, and the DOE scenario effectively carries 2020 chemistry forward, its long-term comparison should be treated cautiously. Demand for heavies could remain strategically important while still falling materially below these estimates as manufacturers use less Dy and Tb or engineer them out of some applications.
Europe, Japan, the United Kingdom, and other markets add meaningful ex-China demand as well, but they do not eliminate the risk of oversupply or underutilization in particular parts of the market. The EU-27 permanent-magnet market projected for 2030 is roughly comparable in scale to the aggressive U.S. case, while Japan’s official material-security target is of the same order and somewhat larger for NdPr; the UK, South Korea, and others add further demand. S&P Global estimates that total ex-China NdPr demand could reach approximately 62 kt in 2030, including roughly 34 kt across the G7 and Australia. The 34.1 kt of selected capacity considered here is therefore roughly comparable to projected G7-plus-Australia demand, but only about 55% of total ex-China demand. As emphasized, however, existing global capacity is already sufficient to meet global demand projections; aggregate ex-China supply estimates are misleading because supply opportunities anywhere depend on consistent and durable public support. As the secondary effects across the mine-to-magnet supply chain take hold, and supply is released back on to world markets, margins will collapse without sustained public support. Most projects in the current pipeline are banking on the same U.S. demand and policy-supported market on some level, often through U.S.-linked processing or offtake arrangements, or from countries covered by U.S. free-trade or critical-minerals agreements. Few countries have been moving as aggressively as the U.S. to de-risk from China.
To be clear, this exercise is mainly intended to illustrate scale and ground the comparison. It may understate the need if Chinese restrictions persist, projects suffer poor recoveries or delayed ramp-ups, or governments maintain strong support for redundancy, geographic dispersion, and domestic production. Likewise, it may overstate the need if manufacturers reduce rare-earth intensity, substitute more abundant materials, expand recycling, or adopt technologies requiring fewer permanent magnets, particularly given the uncertain long-term demand for Dy and Tb. Ultimately, these uncertainties reinforce the need to properly distinguish which projects most effectively and competitively close specific supply-chain vulnerabilities.
Navigating a fragile market
Taken together, the analysis highlights the risks of overbuilding ex-China supply relative to the durable policy-driven demand it is intended to serve. The comparison uses an aggressive U.S. demand scenario, assumes complete displacement of Chinese supply, carries 2020 magnet chemistry forward, and excludes recycling, substitution, material-efficiency gains, and the demand response to higher prices; even the illustrative 10% de-risking case is deliberately generous as a proxy for priority defense-related demand. Europe, Japan, and other economies provide additional markets, but all global demand was already served before export controls, and many projects are pursuing the same ex-China (and especially U.S.-linked) customers, processing routes, offtakes, and policy support. Some announced capacity will undoubtedly arrive late, operate below nameplate, or fail to qualify. Still, once enough alternative capacity comes online, Chinese leverage will weaken, displaced Chinese material will return to contested export markets, be incorporated into additional downstream exports, or contribute to lower Chinese utilization, such that security premiums will narrow, and policymakers and industrial buyers will become less willing to support higher-cost supply. The capacity needed to achieve de-risking may therefore create the very conditions that undermine its commercial viability, leaving a small, segmented, and opaque market exposed to falling prices, low utilization, stranded projects, and renewed dependence when support is withdrawn.
Consumer countries seeking to reduce their exposure to Chinese leverage should take a targeted, coordination-driven approach grounded in specific supply-chain vulnerabilities rather than broad capacity ambitions. The objective should be to secure enough qualified and politically reliable supply to prevent restrictions from choking priority industries, while recognizing that the strategic value of additional capacity will diminish as these vulnerabilities are addressed. Governments should prioritize the products and stages where disruption would be most consequential and design support that endures when shortages ease and prices fall.
We recommend that consumer countries:
- Define clearly how much de-risking is sufficient. Governments should distinguish between requirements for defense and other priority applications, broader industrial demand, strategic inventories, and the substantially larger capacity required for complete independence. Support should be tied to an identified vulnerability rather than an open-ended objective to maximize domestic or allied production.
- Prioritize specific choke points. Separation, metal and alloy production, magnet manufacturing, and access to specialized equipment and technical knowledge are critical.
- Coordinate investments with allies to limit unnecessary duplication. Geographic dispersion and redundancy have strategic value, but multiple governments supporting projects intended to serve the same buyers can produce excess capacity without materially improving resilience.
- Separate support for construction from support for long-term operation. Grants and concessional finance may bring facilities online, while offtake agreements, procurement commitments, price floors, stockpiling, and other demand-side mechanisms may be required to keep strategically important capacity operating through weaker markets.
- Plan explicitly for Chinese material to return to contested markets or compete more aggressively further downstream. Support mechanisms need to remain durable when prices fall and secondary effects take shape.
- Prioritize clear pathways to qualified end use. Projects should demonstrate access to feedstock, downstream conversion, and committed buyers before receiving enduring support, particularly where intermediate products still depend on Chinese processing.
- Preserve flexibility as demand and technology change. Policy should be reviewed against developments in magnet chemistry, substitution, recycling, and manufacturing demand so that support can shift toward unresolved vulnerabilities rather than sustaining duplicative capacity indefinitely.
- Improve price transparency and distinguish commercial prices from policy-supported transactions. Governments should support assessments of traceable non-China material while avoiding the assumption that bilateral offtakes, stockpiling transactions, or government price floors represent an ordinary market-clearing price or are entirely independent of Chinese supply chains.
Producer countries seeking to capitalize on rare earth momentum should take a clear-eyed, geoeconomics-driven approach grounded in market size and buyer behavior. Opportunity is narrow, policy-dependent, and highly sensitive to how much de-risked supply major consumers ultimately decide they need. Governments should target the parts of the supply chain where they have competitive advantages, and work to secure committed demand within those market segments.
We recommend that producer countries:
- Prioritize demand certainty and commercial offtake over broad subsidies or tax breaks. Public support should be disciplined, limited, and tied to concrete investment arrangements rather than offered speculatively.
- Plan explicitly for conditionality and withdrawal risk. Offtake agreements, price floors, government-backed and foreign-backed partnerships can be delayed, renegotiated, amended, or abandoned as market and political conditions change, as we have seen with lithium contracts recently, and producer-country strategies should be robust to this possibility.
- Back fewer, higher-quality projects with stronger underlying economics. It will be preferable to support a small number of commercially viable “champion” projects than to spread scarce public resources thinly across a wide field of marginal ones.
- Be explicit about the target product. Strategies should distinguish clearly between oxides, metals and alloys, and magnets, since each segment has different capital needs, technical barriers, trade partners, and competitive dynamics.
- Align ambition with domestic capabilities and likely market position. Not every producer country should seek to move all the way to magnets; in many cases, the more credible objective may be to establish competitiveness in mining, separation, or selected midstream stages.
- Sequence investments carefully. Upstream projects without downstream pathways, or downstream ambitions without reliable feedstock and buyers, risk creating stranded assets.
- Manage uncertainty in price premiums. Non-China premiums may persist where buyers value traceability and security, but their size is difficult to observe in an increasingly bilateral and policy-supported market. Projects should be assessed against both weaker Chinese benchmarks and the possibility that government-backed premiums or price floors are amended or withdrawn.
Appendix
The selected total includes only the eight facilities shown below. Nameplate capacity is not production, and production is not qualified sales; no uniform execution or utilization haircut is applied. S&P’s broader ex-China refining outlook is shown separately because it is a market-wide estimate and is not directly comparable with this mixed-stage reference.
| Project / location | Chain stage / product | Status / capacity basis | NdPrkt/y | Dy/Tbkt/y | Principal commercial / conversion caveat |
|---|---|---|---|---|---|
| Mountain Pass / MP Materials United States | Mine + concentrator + separator / separated NdPr oxide | Q1 2026 NdPr output annualized | 3.668 | – | Operating separated-oxide output; the reference is an annualized run rate. Durable utilization also depends on qualified downstream demand and support. |
| Lynas / Mt Weld + Malaysia Australia / Malaysia | Mine + concentrator + separator / separated NdPr, Dy and Tb oxides | FY2026 reported output | 7.260 | 0.062 | Operating FY2026 output. Lynas’ under-construction Mt Weld expansion targets 12.0 kt/y of finished NdPr oxide; that forward nameplate is excluded from the selected total. |
| Nolans / Arafura Australia | Planned mine + concentrator + separator / separated NdPr oxide; mixed SEG/HRE stream | Nameplate capacity; FID reached May 2026 | 4.440 | – | Integrated nameplate capacity after FID; output still depends on construction, commissioning, recoveries, customer qualification and ramp-up. The mixed HREE stream is excluded. |
| Eneabba / Iluka Australia | Refinery under construction / separated NdPr, Dy and Tb oxides | Nameplate capacity; feedstock-dependent; under construction | 5.500 | 0.725 | Separation capacity under construction; output depends on suitable feedstock, commissioning, product qualification and sustained utilization. |
| Pela Ema / Serra Verde Brazil | Mine + concentrator / mixed rare earth carbonate; contained equivalent | End-2027 production target / grade estimate | 1.140 | 0.193 | Contained equivalent in mixed carbonate, rather than separated oxide; the material requires downstream separation before it is comparable with qualified oxide supply. |
| White Mesa / Energy Fuels United States | Existing mill + planned separation expansion / separated NdPr, Dy and Tb oxides | Current 1.0 kt NdPr; HREE expansion under construction; larger Phase II planned for 2029 | 6.294 | 0.368 | Total planned capacity includes current 1.0 kt NdPr plus future expansion. Initial Dy/Tb construction has begun, while the larger Phase II remains subject to feedstock, permitting, commissioning and qualification. |
| Yangibana / Hastings Australia | Mine + concentrator / concentrate; NdPr contained equivalent | Target; first production guided for Q4 2026 | 3.400 | – | Contained NdPr in concentrate; the material requires third-party separation and qualification before it is comparable with separated oxide supply. |
| Longonjo / Pensana Angola | Mine + concentrator / mixed rare earth carbonate; contained equivalent | Under construction; commissioning scheduled for 2027 | 2.400 | 0.073 | Contained equivalent in mixed carbonate rather than separated oxide; initial output requires downstream separation and qualification. Post-2030 expansion to 4.2 kt NdPr and 0.122 kt Dy/Tb is excluded. |
| Selected capacity total (before rounding) | 34.102 | 1.421 | |||
Methodological note: the demand side measures Dy, while the supply side combines Dy and Tb. This remains a useful illustration, but it is not a one-for-one material balance. Project names link to the source for each capacity reference.
Footnotes
-
BloombergNEF, Transition Metals Outlook 2025 (December 4, 2025). ↩
-
S&P Global Market Intelligence, “Policy, Economic Resilience Drive New Magnet Supply Chains,” Platts News (April 1, 2026). ↩
-
S&P Global Market Intelligence, “North American Heavy Rare Earth Prices Extend Gains,” Capital IQ Pro, accessed August 4, 2026. ↩
-
The contrast is real but not absolute. Lynas’s Malaysian separation plant operated for more than a decade under contested radioactive-residue licensing; its March 2026 renewal runs ten years but requires water leach purification residue production to cease by 2031, with no new permanent disposal facility. ↩
-
Diana Kinch, “Brazil Set to Boost Critical Minerals Trade with China after Talks: Ibram,” S&P Global Market Intelligence (July 30, 2026). ↩
-
S&P Global estimates approximately 14,000 tonnes of U.S. NdPr demand in 2028 using NdPr contained in final products. This is higher than the DOE-based 2030 estimate used here, reflecting differences in methodology, scope, and forecast vintage. Even under the higher S&P estimate, selected capacity of 34,100 tonnes would equal roughly 2.4 times total U.S. demand and more than 24 times a 10% de-risking case. ↩
-
Nd₂O₃ is about 85.7% Nd by mass, Pr₆O₁₁ is about 82.8% Pr by mass, and Dy₂O₃ is about 87.1% Dy by mass. Without Nd and Pr splits, using 0.85 for combined NdPr oxide is a reasonable approximation. ↩